Configure Observability
Overview
VirtServer supports exporting observability metrics using the OpenTelemetry™ Protocol (OTLP) over gRPC (default port 4317) or HTTP (port 4318). These metrics help you monitor the health of your VirtServer instance, set alerts, and tune performance parameters.
Exported metrics cover:
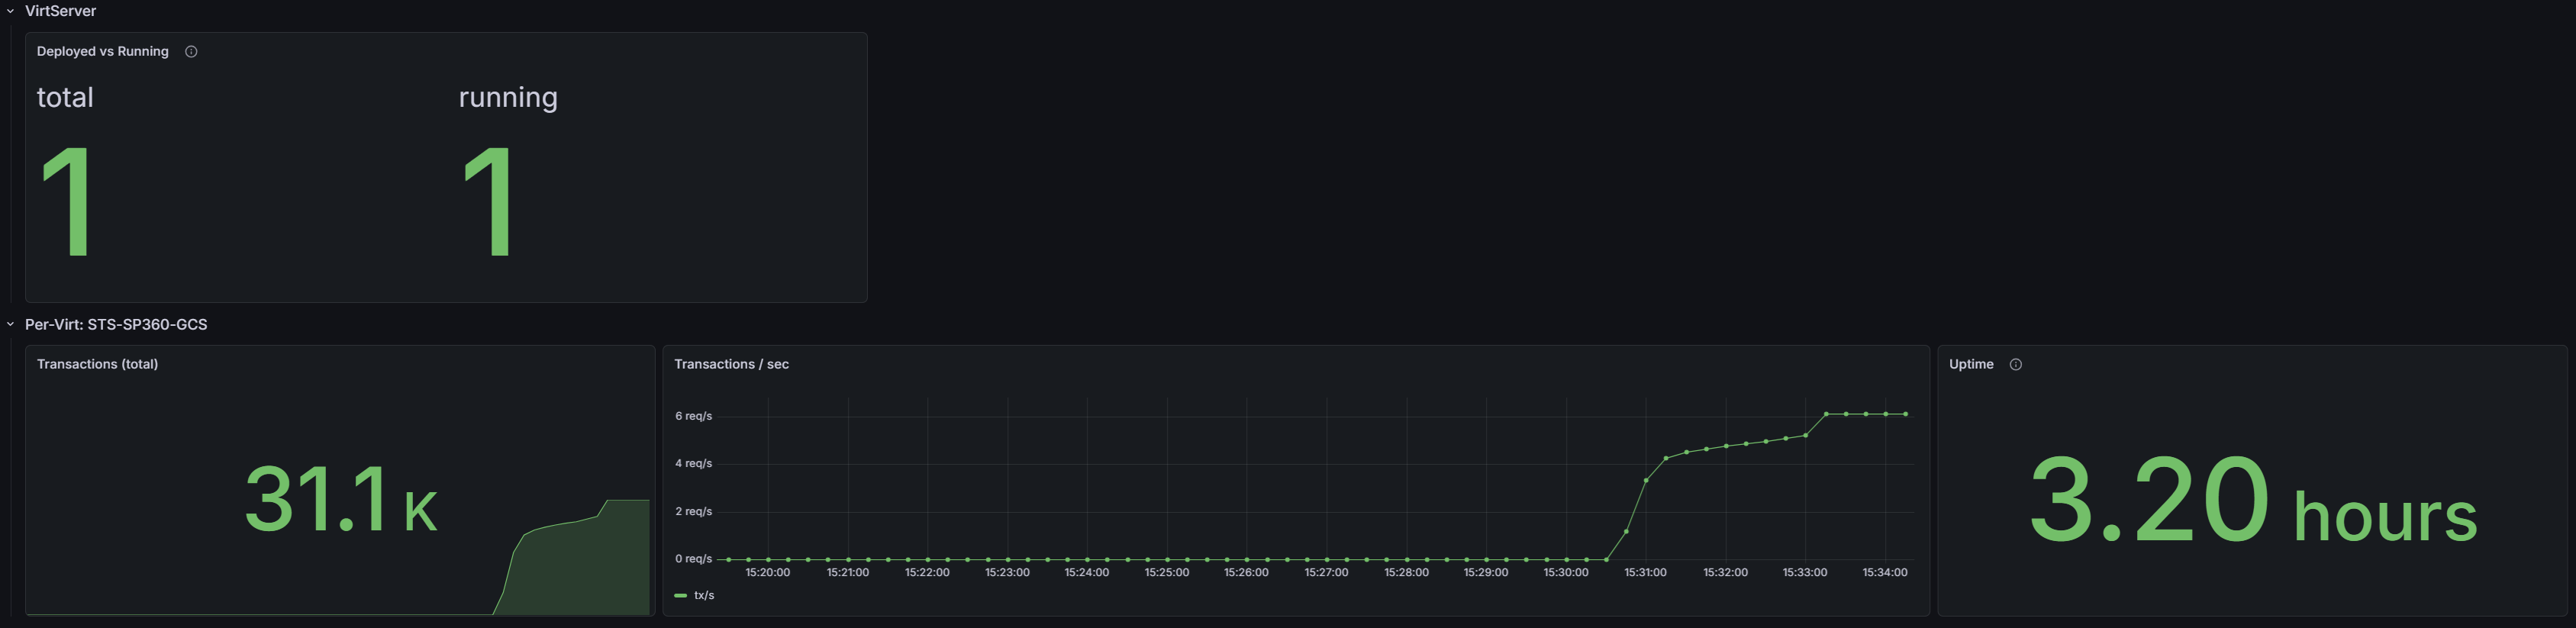
VirtServer application state - deployed and running virtual service counts, per-virt traffic, and uptime.
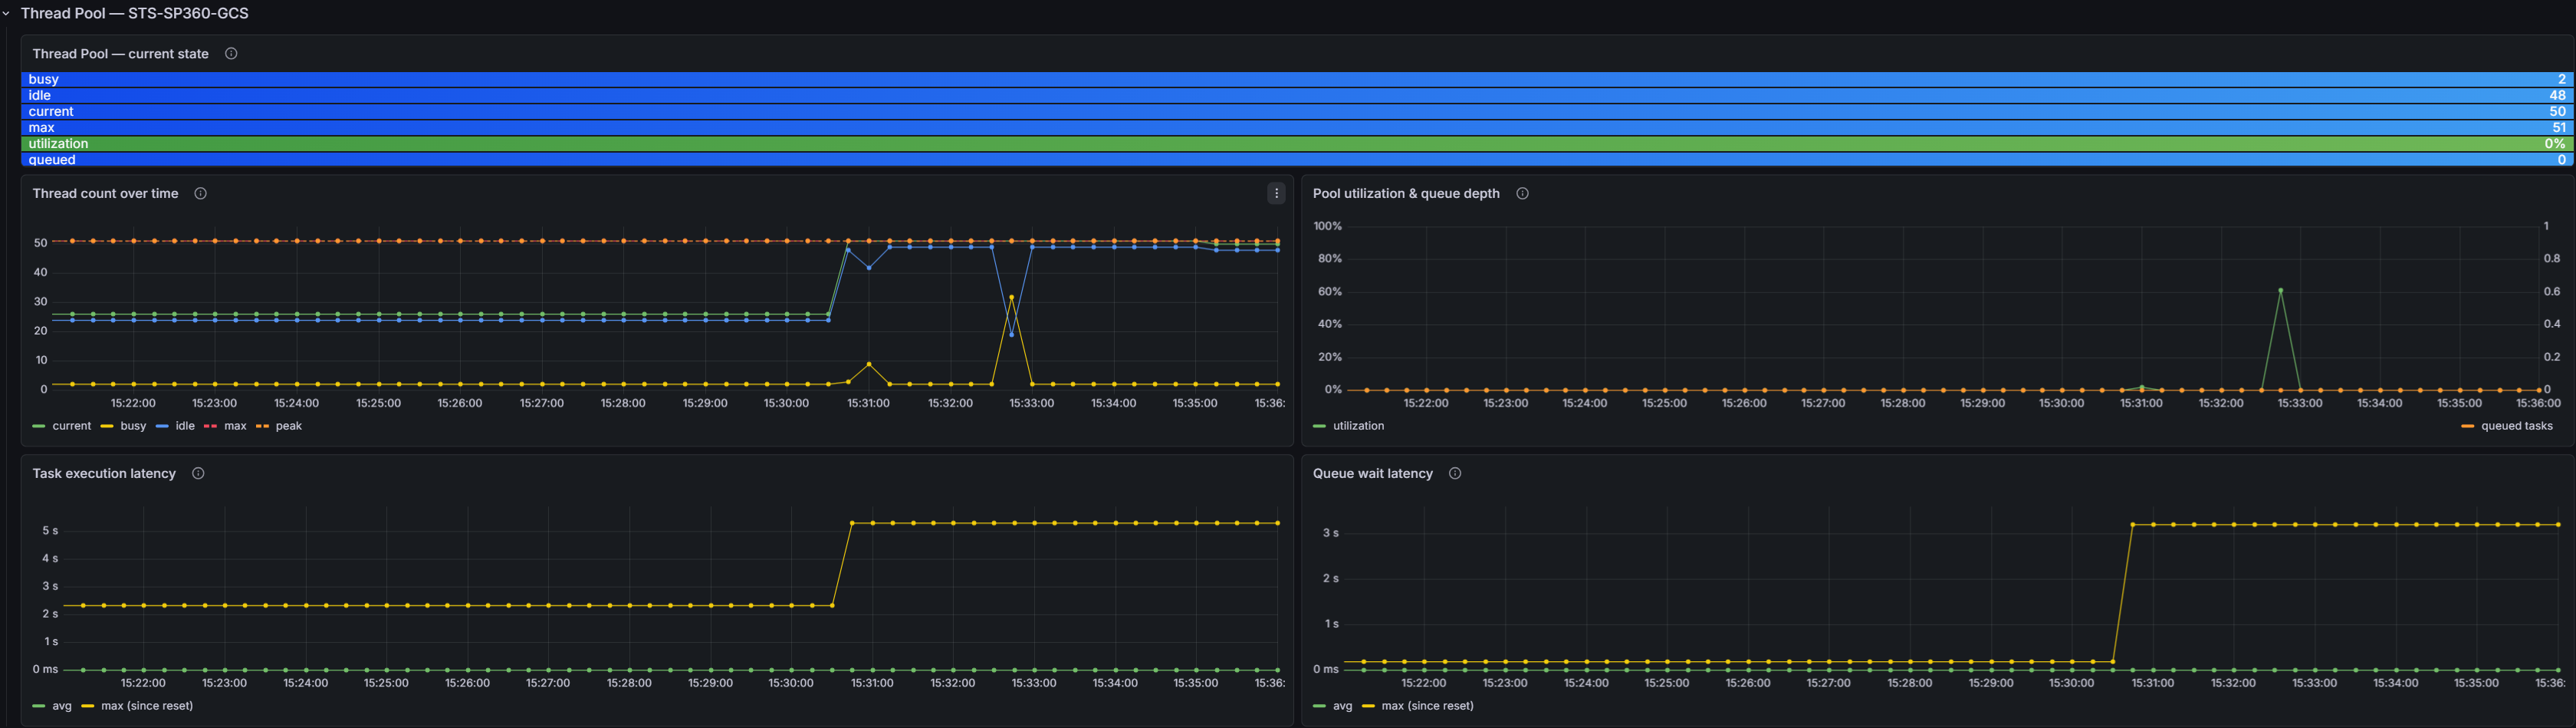
Jetty thread pool health - per-virt thread pool utilization, queue depth, and latency.
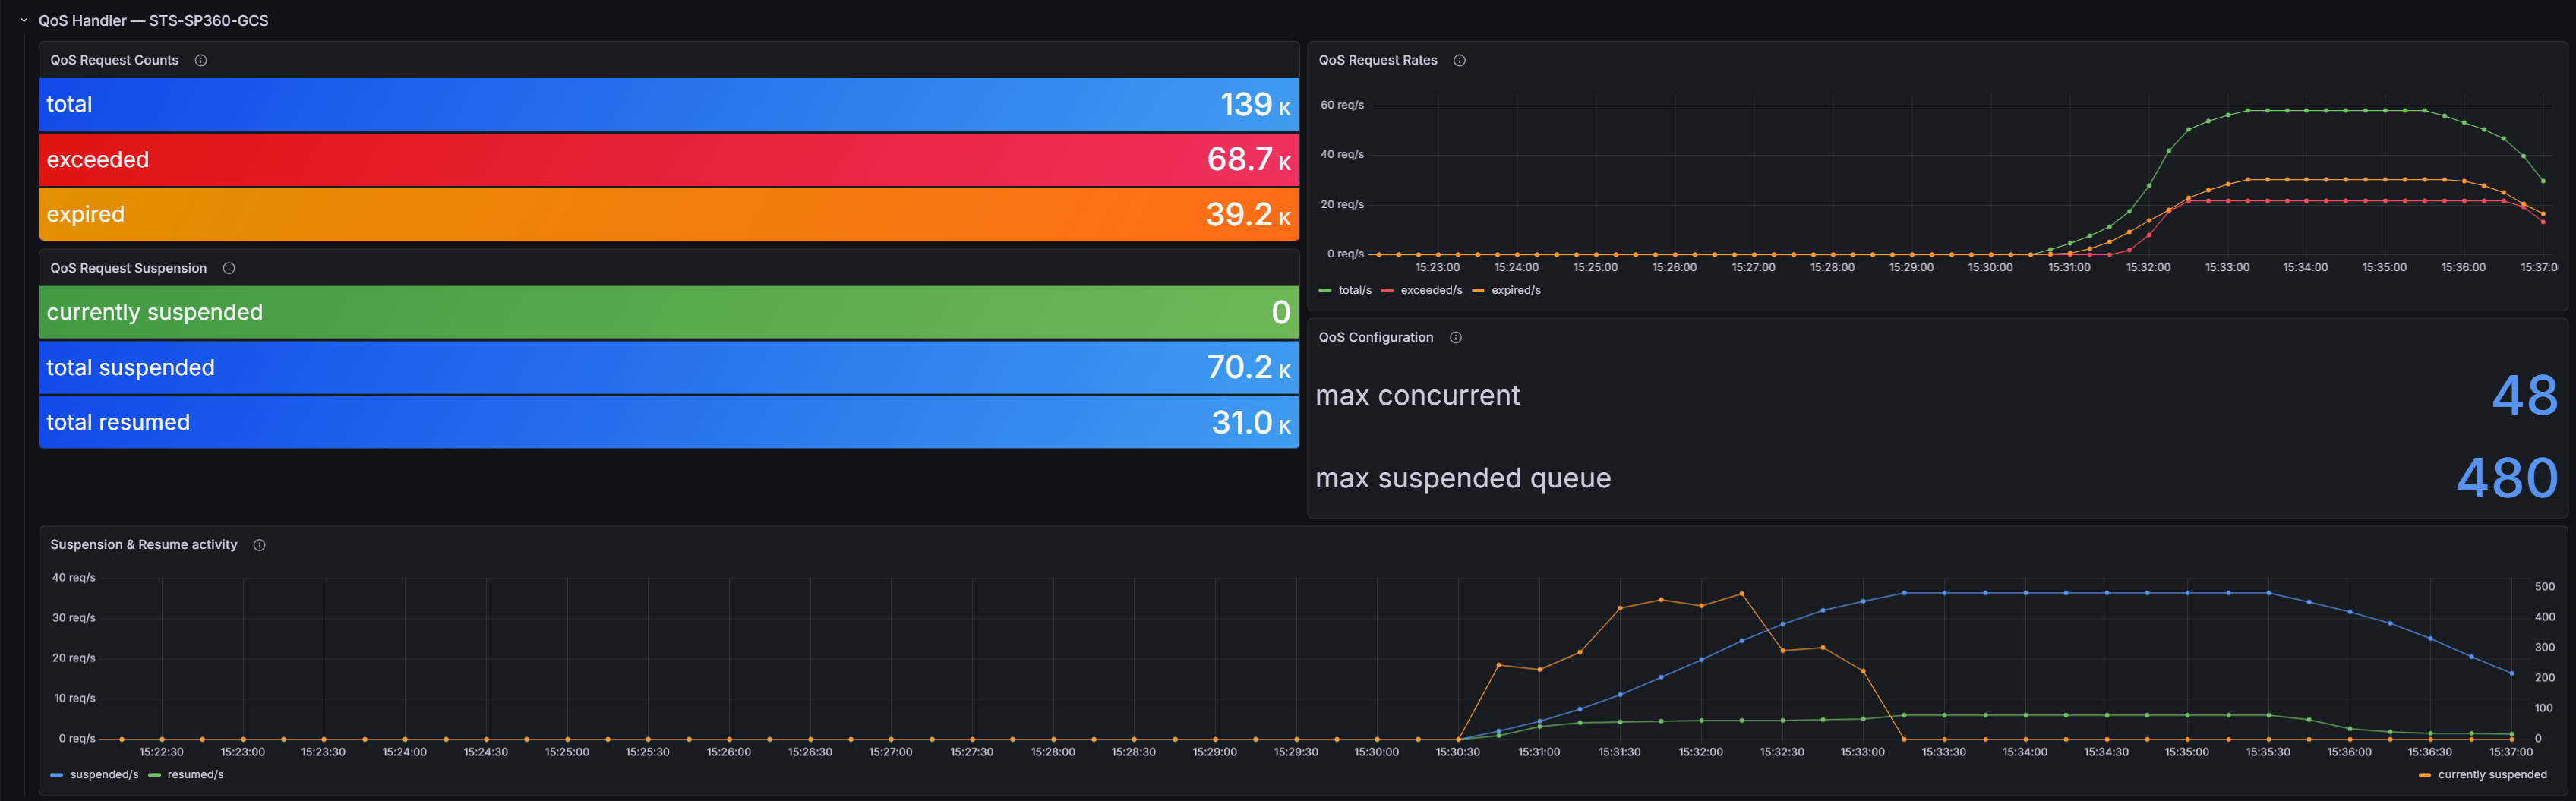
QoS (Quality-of-Service) handler - per-virt request throughput and rejection/timeout counters.
All per-virtual-service metrics carry a virt_name label containing the virtual service name, so you can filter and aggregate by individual virtual service in any compatible backend.
Note
VirtServer only produces metrics and pushes them through OTLP. Connecting an OTel-compatible collector and backend is the responsibility of the VirtServer operator.
Enabling observability
Observability is disabled by default. To enable it, add or uncomment the otelConfiguration block in virt-server.yml, located in ~/.readyapi/virt-server/ on the server host, then restart VirtServer.
Note
Docker: If VirtServer runs with a shared file system using -v, update virt-server-docker.yml inside the shared folder instead. For more information, see Run VirtServer in Docker.
otelConfiguration:
  # Enable OTLP metrics export
  enabled: true

  # Exporter type: otlp (push to a collector) or none
  metricsExporter: otlp

  # Service name reported to the OTel backend
  # Use distinct names if you run multiple VirtServer instances
  serviceName: readyapi-virtserver

  # Export interval in milliseconds (default: 60000 = 1 minute)
  # Caution: smaller intervals increase publish overhead and backend storage needs
  exportIntervalMs: 60000

  # OTLP collector gRPC endpoint
  endpoint: http://<your-collector-host>:4317

  # (Optional) Path to a custom JMX metrics rules file
  # Default: ~/.readyapi/virt-server/jetty-jmx-metrics.yaml
  # jmxMetricsConfigPath: /path/to/jetty-jmx-metrics.yaml
The endpoint must point to an OpenTelemetry Collector or compatible receiver that you manage. Common choices include the OTel Collector, Grafana Alloy, or any backend with a native OTLP receiver such as Datadog, Dynatrace, Honeycomb, and New Relic.
JMX metrics configuration file
Jetty internal metrics (thread pool and QoS handler) are opt-in. You configure them through a YAML rules file.
Distribution | Default path |
|---|---|
Linux / macOS (installer or ZIP) |
|
Windows |
|
Docker |
|
Custom path | Set |
Note
jetty-jmx-metrics.yaml is included with VirtServer from version 3.34.0 onwards.
File structure
The file uses the OpenTelemetry JMX Metric Insight YAML format. Each rules entry matches a JMX MBean pattern and maps MBean attributes to OTel metrics:
rules:
  - bean: <JMX ObjectName pattern with wildcards>
    metricAttribute:
      <otel.label.name>: beanattr(<MBeanAttributeName>)
    mapping:
      <MBeanAttributeName>:
        metric: <otel.metric.name>
        type: counter | gauge | upDownCounter
        unit: "<unit>"
        desc: <description>
To enable a commented-out metric, remove the # prefix from the relevant lines and restart VirtServer. To disable an active metric, comment it out the same way.
Note
VirtServer does not hot-reload the JMX metrics file. A full restart is required for changes to take effect.
Metrics reference
Prometheus metric names appear as they show in a Prometheus scrape or compatible backend. OpenTelemetry counters gain a _total suffix; nanosecond-unit gauges gain a _nanoseconds suffix; second-unit gauges gain a _seconds suffix; ratio gauges gain a _ratio suffix.
VirtServer application metrics
These metrics are built into VirtServer and are exported automatically when observability is enabled. You cannot modify them through the JMX YAML file.
Prometheus metric name | Type | Labels | Description |
|---|---|---|---|
| Gauge | - | Total number of deployed virtual services (running + stopped) |
| Gauge | - | Number of virtual services currently running |
| Counter |
| Total HTTP requests received by each virtual service since it was last started |
| Gauge |
| Seconds since the virtual service was last started. Only present for running virtual services. |
 |
Jetty thread pool metrics
One set of metrics is emitted per virtual service. The virt_name label identifies which virtual service's thread pool each series belongs to. The max threads configured for the virtual service acts as the maximum value for the Jetty thread pool.
JMX MBean pattern:
com.smartbear.servicev.core.engine.thread:type=qtpbackedvirtthreadpool,*
Prometheus metric name | Type | Unit | Description |
|---|---|---|---|
| UpDownCounter | threads | Current total number of threads in the pool (busy + idle) |
| UpDownCounter | threads | Threads actively executing a request |
| UpDownCounter | threads | Threads waiting for work |
| Gauge | threads | Configured maximum thread pool size |
| UpDownCounter | tasks | Tasks are queued waiting for a free thread |
| Gauge | threads | Peak busy thread count since last reset |
| Gauge | ratio 0–1 | Fraction of max threads currently busy (busy / max). Use thresholds at 0.7 (warn) and 0.9 (critical). |
| Gauge | ns | Average time tasks spend in the queue before a thread picks them up |
| Gauge | ns | Maximum queue wait time observed since last reset |
| Gauge | ns | Average task execution duration (time on thread, excluding queue wait) |
| Gauge | ns | Maximum task execution duration since last reset |
All thread pool metrics carry the virt_name label.
 |
QoS handler metrics
The Quality-of-Service (QoS) handler is a Jetty handler that enforces per-virt concurrency limits, protecting VirtServer from overload. Configure the QoS handler using the VMOptions described in Thread management JVM options. One set of metrics is emitted per virtual service.
JMX MBean pattern:
com.smartbear.servicev.core.model.http.impl:type=virtqoshandler,*
Prometheus metric name | Type | Description |
|---|---|---|
| Counter | Total requests processed by the QoS handler (all outcomes) |
| Counter | Requests were rejected immediately because the concurrency limit was already reached. VirtServer returns these with the configured reject status code (default: 503). |
| Counter | Requests that were suspended but timed out before a slot became available. VirtServer returns these with the configured reject status code (default: 503). |
Available metrics (commented out in jetty-jmx-metrics.yaml)
To activate these metrics, uncomment the relevant lines in jetty-jmx-metrics.yaml and restart VirtServer.
Prometheus metric name | Type | JMX attribute | Description |
|---|---|---|---|
| UpDownCounter |
| Requests currently suspended in the wait queue |
| Counter |
| Cumulative count of requests ever suspended by the QoS handler |
| Counter |
| Cumulative count of suspended requests that were eventually resumed |
| Gauge |
| Configured maximum concurrent requests allowed before rejection |
| Gauge |
| Configured the maximum time (ms) a request can wait in the suspend queue |
| Gauge |
| Configured the maximum number of requests that can be suspended simultaneously |
All QoS metrics carry the virt_name label.
 |
Connecting to a metrics backend
VirtServer exports metrics in OTLP format only. The endpoint value in virt-server.yml is the only VirtServer-side configuration that changes between backends.
Backend | Recommended approach | Endpoint example |
|---|---|---|
Prometheus + Grafana | Deploy an OTel Collector with an OTLP receiver and a Prometheus exporter. Configure Prometheus to scrape the collector. |
|
Grafana Cloud | Use Grafana Alloy or point the OTLP endpoint directly at Grafana Cloud's OTLP gateway. |
|
Datadog | Run the Datadog Agent with OTLP ingestion enabled. |
|
Dynatrace | Use the Dynatrace OTLP ingest endpoint. |
|
New Relic | Point directly at New Relic's OTLP endpoint with your licence key header. |
|
If your backend does not natively support OTLP, deploy an OTel Collector as an intermediary. The collector receives OTLP from VirtServer and forwards it to your observability platform through its exporters.
Quick-start example: OTel Collector + Prometheus
The following minimal OTel Collector configuration receives OTLP from VirtServer and exposes a Prometheus scrape endpoint on port 8889:
receivers:
  otlp:
    protocols:
      grpc:
        endpoint: 0.0.0.0:4317
      http:
        endpoint: 0.0.0.0:4318
processors:
  batch: {}
exporters:
  prometheus:
    endpoint: 0.0.0.0:8889
    metric_expiration: 30m
    resource_to_telemetry_conversion:
      enabled: true  # surfaces resource attributes such as service.name and service.version as labels
service:
  pipelines:
    metrics:
      receivers: [otlp]
      processors: [batch]
      exporters: [prometheus]
Point Prometheus at http://<collector-host>:8889/metrics and configure your Grafana datasource accordingly.
Troubleshooting
Symptom | Likely cause | Action |
|---|---|---|
No metrics at all |
| Set |
VirtServer application metrics present, but no Jetty or QoS metrics |
| Verify the file exists at |
Jetty metrics present, but no | MBean attribute not resolved at collection time | Confirm the virtual service is running (not just deployed) and verify the |
Metric values stale or missing after a virt restart |
| Increase |
Newly uncommented YAML metrics are not appearing | VirtServer has not been restarted after the YAML edit | Restart VirtServer - the JMX YAML file is read-only at startup |